

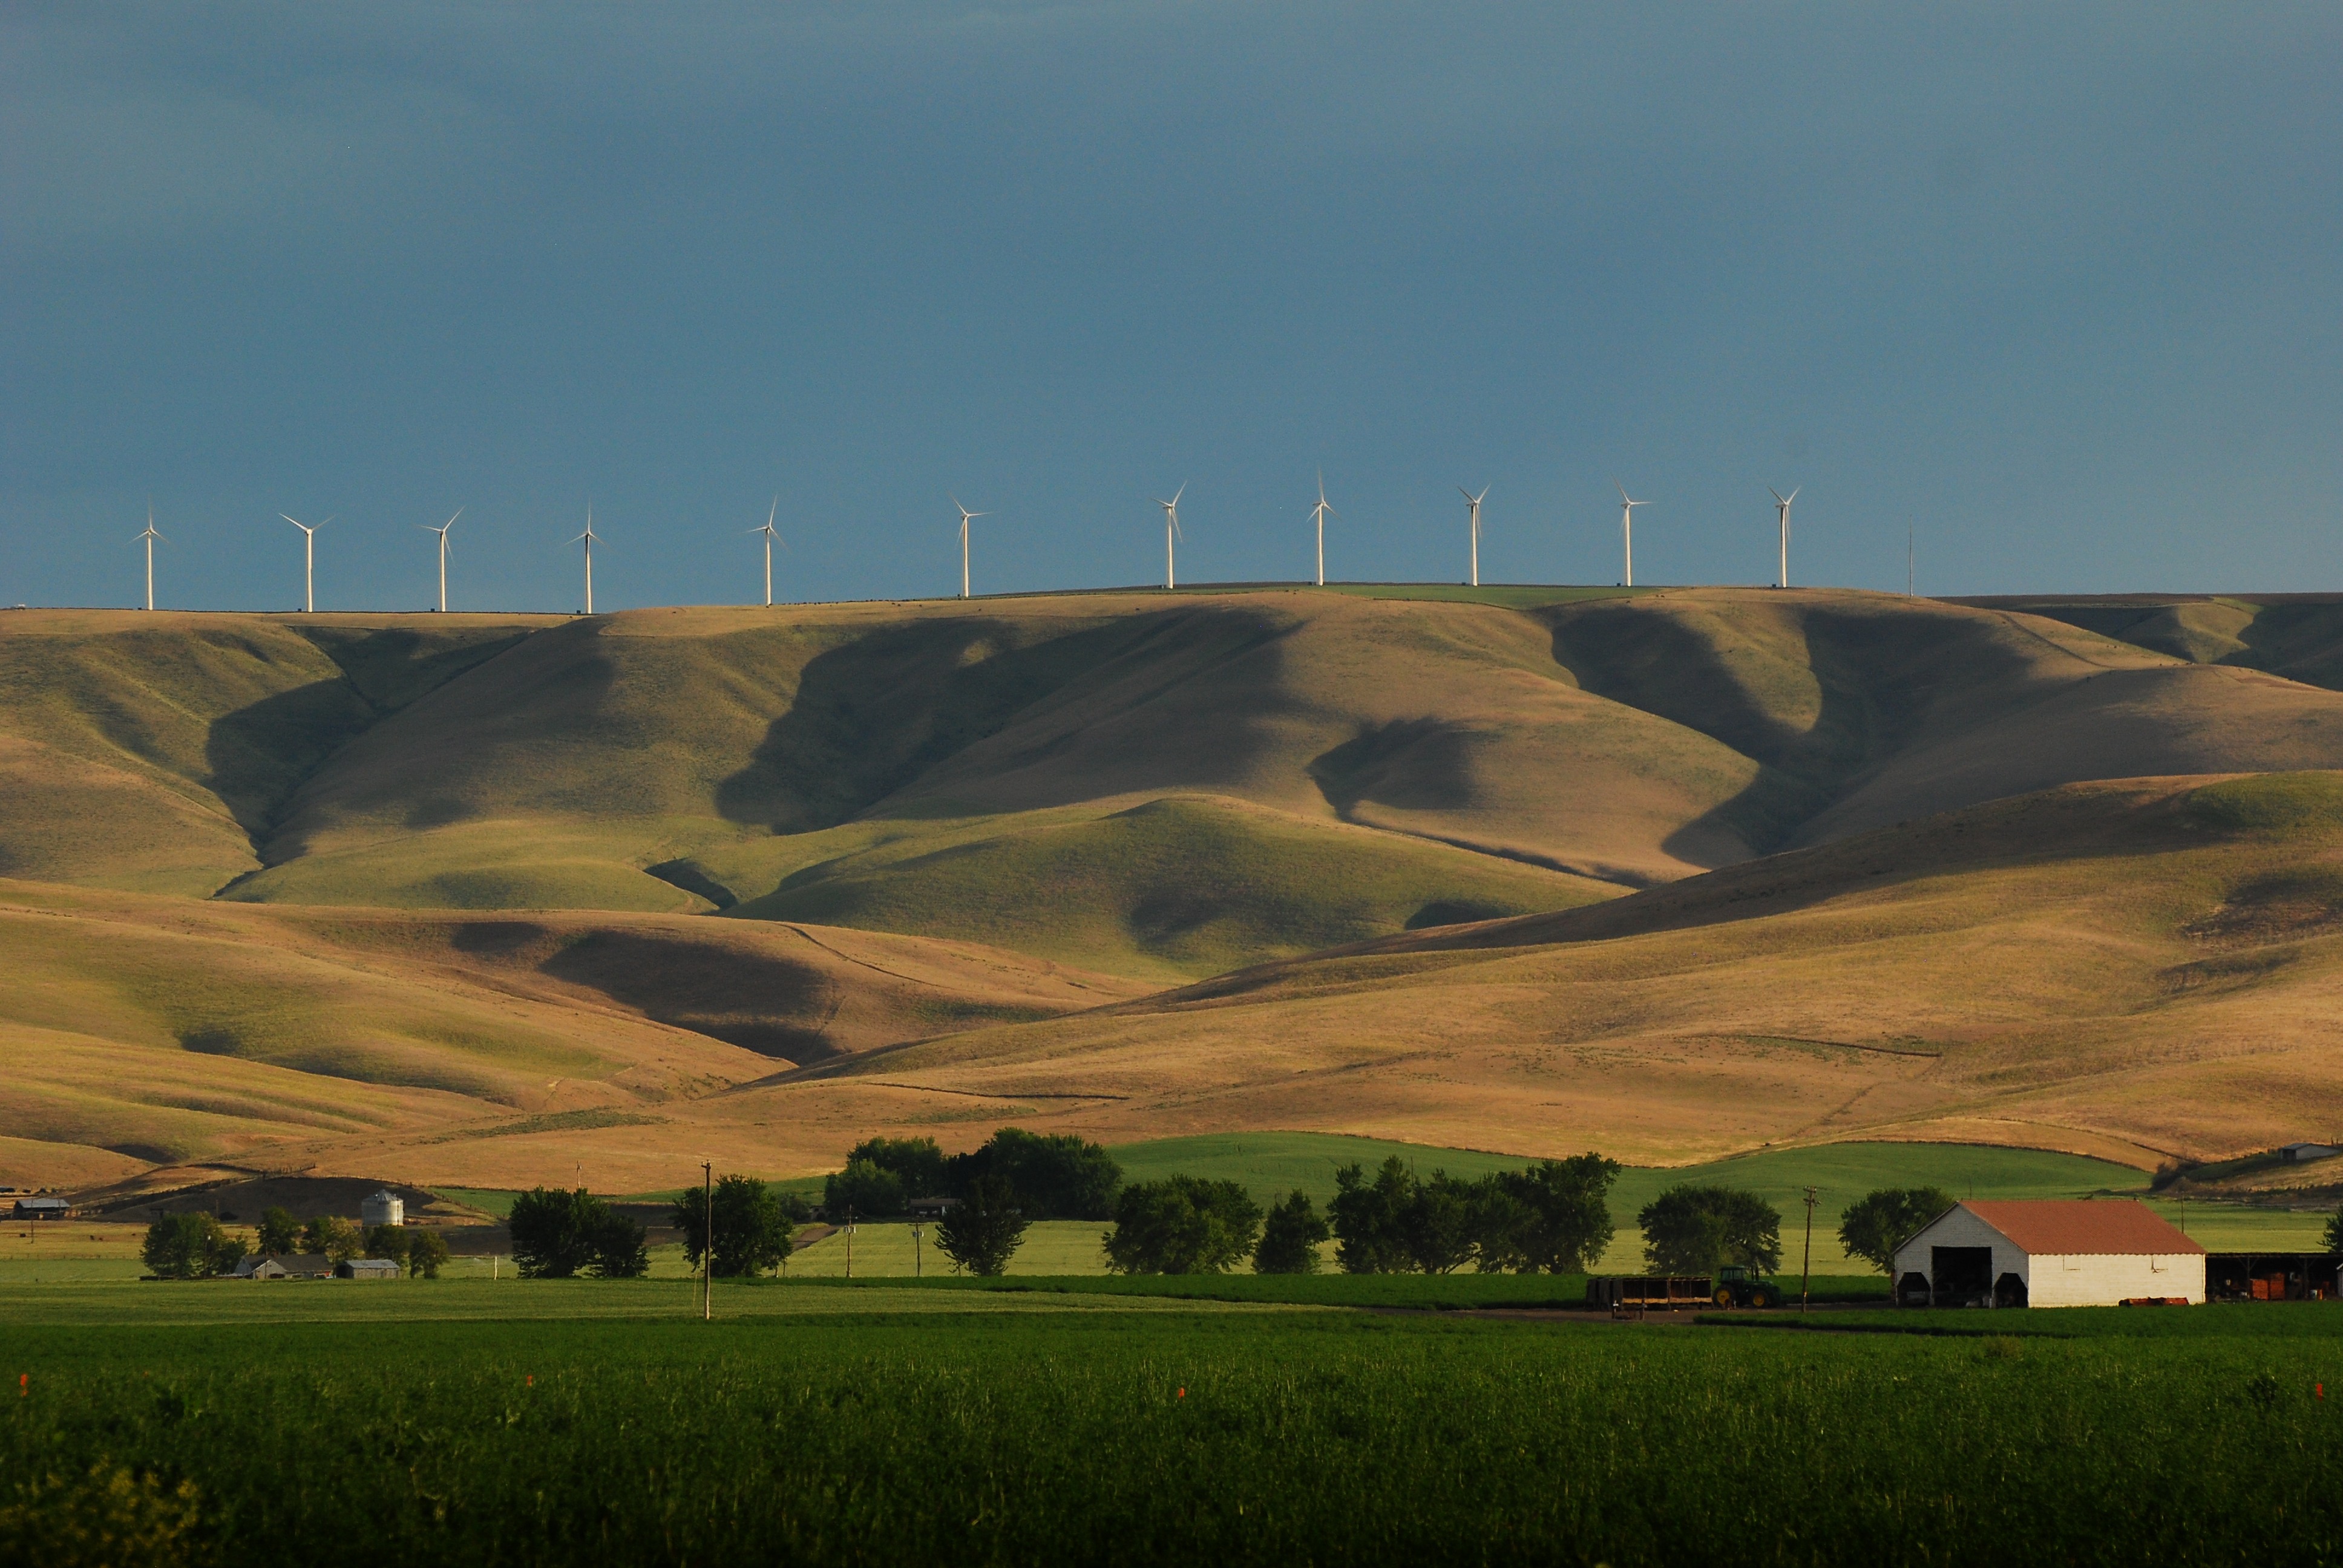
Some look at wind farms and find them an ugly scar on an otherwise beautiful landscape. I disagree. I think they are grand, graceful, wonders of modern engineering and with every powerful rotation they are working to preserve the beauty of the natural surroundings in which they stand.

Wind turbines are a great source of renewable energy, but they are not the correct solution for anywhere and everywhere. In this post I am looking at what factors influence the suitability and feasability of Wind Turbines.
The first thing to consider is the SUITABILITY. What is the annual average wind speed in the proposed location? If data suggests thats the average is LESS that 4.5m/s (meters per second), then the context is actually not suitable and one should consider and alternative such as Solar PV.
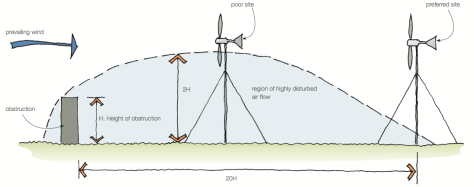
Next consideration is a location for the turbine. There are a few factors that influence how well the turbine will work in a given context. Buildings and trees disrupt that passage of wind causing turbulence which has a negative impact of the efficiency of the turbine (see image below. Source). The ideal setting is the top of a rounded hill which is why you often see the very large turbines in rural settings on a high point or out at sea.
Wind speed also increases with height so the higher the better. There is a limit to this of course – building control may have regulations that govern the maximum height of turbines – particularly in urban settings. Also, one needs to consider the cost and ease of maintenance with a taller installation.
The turbine should be installed to face prevailing winds. Work out what these are in the specific context. The turbines have some flexibility around their pivot point but for maximum benefit, position them carefully.
There are some useful calculations or ratios to consider (Source: Energy Savings Trust):
- The power available from the wind is related to the cube of the wind speed. So a 20% increase in wind results in double the power output
- The power output of the turbine equates to the square of the diameter of the rotary blades. So a 20% increase in diameter will give you 44% more power.
Have you ever seen a turbine or group of turbines and they dont seem to be working even though there is some wind… well that is because turbines work to minimum and maximum wind speeds. The CUT IN speed refers to the minimum speed that the wind must be for the blades to start rotating and generating electricity. The smaller the turbine the earlier the cut in speed. So a small 500W turbine may cut in at 3.5m/s but the very large industrial ones will start around 10m/s.
.jpg)
As shown in the graph above, there is also a CUT OUT speed. Turbines have an in-built braking system to protect the motor from over-use and strain. For domestic / smaller turbines (typically 500W – 25kW) cut out speed is around 25m/s. Look out for the maximum design wind speed which should be around 50 – 60m/s. These are rare gust speeds but turbines must be designed to withstand such forces.
ENERGY OUTPUT
Every turbine will advertise a RATED / PEAK OUTPUT. It will come as a 1500kW Turbine for example. What this is essentially saying is that at an ideal wind speed of x, you will get 1500kW of power. The system should say what the wind speed is for the rated output – in the case of the 1500kW Turbine, it may be 12m/s.
In reality, the wind will not blow consistently at 12m/s. One can expect about 25% to 30% of the theoretical rated output. To use the example of the 1.5kW Turbine with rated speed of 12m/s. The theoretical output is 13 150 kWh/yr (1.5kW x 8760hrs), when in actual fact due to fluctuations in the wind (even if the annual average is 12m/s) as well as inefficiencies such as turbulance – 30% of that is your likely yeild = 4000kWh/yr. This is why one must be careful not to size the system based on the rated output but take into account the annual average wind speed and allow for inefficiencies. The average American household consumes 10 000kWh/yr (28kWh/day) (Source) so this 1.5kW turbine would only provide 40% of the demand. They might thus consider a larger 3kW system if budget and site restrictions allow.
An oversized system may be very lucrative where excess electricity is fed back to the national grid, generating money. This is demonstrated in the example below:
A 250-kW turbine installed at the elementary school in Spirit Lake, Iowa, provides an average of 350,000 kWh of electricity per year, more than is necessary for the 53,000-square-foot school. Excess electricity fed into the local utility system earned the school $25,000 in its first five years of operation. The school uses electricity from the utility at times when the wind does not blow. This project has been so successful that the Spirit Lake school district has since installed a second turbine with a capacity of 750 kW. (Source)

Payback periods are determined if you work out the annual savings (cost of electricy / kWh) relative to the cost of the installation and maintenance. If you are able to generate money by feeding excess energy back to the grid this will definately improve the feasability as the payback period deminishes.
In rural settings it may be both suitable and feasible to install a larger turbine to feed a group of houses – a 25kW Turbine might provide ample power for 5-8 houses. Due to it’s larger size it would be located further away where noise and visual disruption can be minimised.

INDEPTH LOOK AT AN EXAMPLE OF A TURBINE

The AWP 3.7 from African Wind Power is one I came across on the web while browsing. It has a rotation diameter of 3700mm and would be suitable for domestic type usage.
The following graph is helpful to explain the relationship between wind speed and power output:

The peak output of 1.5kW is achieved at wind speed of 12m/s. Cut in speed is shown at around 2.5m/s.
Furthermore, the manufacture notes that the predicted energy yield per day for differing wind speeds is as follows:
- 4m/s = 8kWh/day
- 5m/s = 12kWh/day
- 6m/s = 20kWh/day
PROS & CONS
Pros:
- Renewable energy source
- low CO2 emmisions
- Can generate money if feeding back to national grid
- Free energy once payback period is expired
Cons:
- Not suitable for areas with wind speed less than 4.5m/s
- Not suitable for densely populated areas (turbulance = inefficient wind speed)
- Initial cost is expensive
- Can be noisy – whirring of blades and buzzing of generator
- If fixed to roof of building, vibration can be annoying
LOCAL WIND DATA
Interesting fact – Cape Denison in Antarctica is the windiest place on earth with annual average wind speed of 20m/s. Joburg, Cape Town and Durban are 4.5m/s, 6m/s & 5m/s respectively.

For useful weather data for South Africa visit: Windfinder
For more technical detail and calculations visit: www.wind-power-program.com
Article about scientific response to claims that wind turbines make people sick: Discover
